Verified October 28, 2026. Prices and rents are September 2026 figures. Every source is listed at the bottom of the page.
Toronto vs Vancouver: the scorecard at a glance
We compared the two cities on 11 things people weigh up when they move. Where we could, we used official numbers: Statistics Canada, the two real estate boards, Environment and Climate Change Canada, and the city and provincial governments. Toronto figures cover the Toronto region (the GTA board area or the Toronto census metropolitan area). Vancouver figures cover Greater or Metro Vancouver.
| Round | Toronto | Vancouver | Edge |
|---|---|---|---|
| 1. Benchmark home price | $917,600 | $1,075,900 | Toronto |
| 2. Average asking rent | $2,556 | about $2,750 | Toronto |
| 3. Median after-tax household income (2020) | $85,000 | $79,500 | Toronto |
| 4. Unemployment rate (Sept 2026) | 6.9% | 6.5% | Vancouver |
| 5. Provincial income tax at $100,000 | about $7,130 | about $5,900 | Vancouver |
| 6. Transfer tax on a $1M home | $32,950 | $18,000 | Vancouver |
| 7. Average commute | 34.9 min | 31.1 min | Vancouver |
| 8. Weather | Sunnier, snowy winters | Mild, wetter, greyer | Depends on you |
| 9. Nature on the doorstep | Lake and ravines | Ocean and mountains | Vancouver |
| 10. EIU liveability rank | 16th (2025) | 9th (2026) | Vancouver |
| 11. Resident mood | 55% open to leaving for cheaper city | 46% | Vancouver, narrowly |
Final count: Vancouver 7, Toronto 3, one tie. The table hides something important, though. Toronto’s three wins are housing, rent and income, the three items that decide most household budgets. Read the rounds before you pick a side.
Round 1: Buying a home in Toronto vs Vancouver
Both markets are cooling at almost exactly the same pace. In September 2026 the GTA’s MLS Home Price Index benchmark was $917,600, down 4.7% from a year earlier, according to TRREB. Greater Vancouver’s composite benchmark was $1,075,900, down 5.5%, according to Greater Vancouver Realtors data reported by The Canadian Press.
| Measure | GTA (TRREB) | Greater Vancouver (GVR) |
|---|---|---|
| Composite benchmark price | $917,600 | $1,075,900 |
| Benchmark change, year over year | -4.7% | -5.5% |
| Home sales | 5,040 (-9.0%) | 1,717 (-8.4%) |
| Average selling price | $1,006,409 | Not used here (see note) |
| Average condo apartment price (GTA) | $605,257 (-7.7%) | n/a |
The arithmetic. $1,075,900 minus $917,600 is $158,300, so a benchmark home in Greater Vancouver costs about 17% more. Now compare prices with incomes. The latest census figures for median after-tax household income are $85,000 for Toronto and $79,500 for Vancouver. That puts the benchmark price at about 10.8 years of income in Toronto ($917,600 ÷ $85,000) and about 13.5 years in Vancouver ($1,075,900 ÷ $79,500). These are Local Toronto calculations. The incomes are from 2020, so treat the ratios as a rough guide.
Compare like with like. A benchmark price describes a typical home. An average price is pulled up by expensive sales. Comparing Toronto’s $1.006 million average with Vancouver’s $1.076 million benchmark would understate the gap, so we only compare benchmark with benchmark. For the full September picture in the GTA, see our Toronto housing market report.
Edge: Toronto.
Round 2: Rent in Toronto vs Vancouver
Rentals.ca and Urbanation’s September 2026 report put Toronto’s average asking rent at $2,556 and Vancouver’s at about $2,750 (Daily Hive’s two write-ups of the report give $2,741 and $2,754). In Vancouver, one-bedroom units averaged $2,373 and two-bedrooms $3,271. Nationally, asking rents fell 4.2% to $2,034, the 24th straight month of annual declines. Urbanation’s president said rents in both cities “have trended higher over the past six months.”
The arithmetic. A gap of about $195 to $200 a month comes to roughly $2,300 to $2,400 a year. These are asking rents on listings, not what sitting tenants pay. For rents by GTA city and bedroom count, see our GTA rental market report.
Edge: Toronto.
Rounds 3 and 4: Income and jobs
Income. In the 2021 Census, median after-tax household income in 2020 was $85,000 in the Toronto CMA and $79,500 in the Vancouver CMA. Vancouver’s grew faster: up 16.1% from 2015 in real terms, compared with 14.1% for Toronto. These are the newest census income figures by metro area. 2020 incomes were lifted by pandemic benefits, so read them as a relative comparison. Edge: Toronto.
Jobs. In Statistics Canada’s September 2026 Labour Force Survey (seasonally adjusted three-month averages, as reported by The Canadian Press), unemployment was 6.9% in Toronto and 6.5% in Vancouver. The national rate was 6.5%. Vancouver was also lower in July (6.0% vs 6.7%), but Toronto’s rate has fallen faster over the past year. Edge: Vancouver.
Rounds 5 and 6: Income tax and land transfer tax
Provincial income tax
Federal tax is the same in both cities, so only the provincial share differs. BC raised its lowest rate from 5.06% to 5.60% for 2026. Even so, BC is cheaper at every income we tested once you add Ontario’s surtax and Health Premium.
| Taxable income | Ontario (incl. surtax and Health Premium) | British Columbia | Ontario pays more by |
|---|---|---|---|
| $60,000 | $3,225 | $2,822 | $402 |
| $100,000 | $7,128 | $5,902 | $1,226 |
| $150,000 | $15,170 | $11,977 | $3,193 |
Estimate. Local Toronto calculation using the 2026 brackets for both provinces, each province’s basic personal amount ($12,989 Ontario, $13,216 BC), Ontario’s surtax thresholds ($5,818 and $7,446) and the Ontario Health Premium schedule. It leaves out CPP, EI and other credits, so your real figures will differ. This is not tax advice. Edge: Vancouver.
Land transfer tax when you buy
Toronto buyers pay land transfer tax twice: once to Ontario and once to the City of Toronto. BC charges a single property transfer tax: 1% on the first $200,000, 2% up to $2 million and 3% above that.
| Price | Toronto, repeat buyer | Toronto, first-time buyer | Vancouver, repeat buyer | Vancouver, first-time buyer |
|---|---|---|---|---|
| $600,000 | $16,950 | $8,475 | $10,000 | $2,000 |
| $800,000 | $24,950 | $16,475 | $14,000 | $6,000 |
| $1,000,000 | $32,950 | $24,475 | $18,000 | $18,000 |
How it works: Toronto first-time buyers get up to $4,000 back from Ontario and up to $4,475 from the city. BC’s first-time buyer exemption removes the tax entirely up to $500,000. From $500,001 to $835,000 it is a flat $8,000, it shrinks to zero at $860,000, and there is nothing above that. That is why a $1 million first home costs the same tax as a repeat purchase in Vancouver. Our first-time buyer land transfer tax examples show the Toronto maths step by step. Edge: Vancouver.

Round 7: Getting to work
Statistics Canada’s May 2025 commuting survey found that Toronto has the longest average commute of any large Canadian city: 34.9 minutes, up 1.6 minutes from a year earlier. Vancouver’s was 31.1 minutes, about the same as the year before. Commuters in the two regions get to work in similar ways. 69.4% of Toronto commuters go by car, the lowest share among Canada’s 15 largest metros. Vancouver’s 70.1% is third lowest, behind Montreal.
The arithmetic. 3.8 extra minutes each way, twice a day, over about 235 workdays comes to roughly 30 hours a year, close to four working days. That is a Local Toronto estimate for someone commuting every workday.
Edge: Vancouver.
Round 8: Weather
This is where most debates about the two cities start, and the numbers don’t settle it. Vancouver has milder winters and much less snow. Toronto has more sunshine and hotter summers.
| Measure | Toronto Pearson | Vancouver International |
|---|---|---|
| Snowfall per year | 114.5 cm | 36.6 cm |
| Days with snow | 44.7 | 7.4 |
| Days with rain, snow or drizzle | 147.3 | 169.5 |
| Total precipitation | 806.8 mm | 1,159.5 mm |
| Bright sunshine per year | 2,161 hours | 1,938 hours |
| Days with no sun at all | 57 | 76 |
| December sunshine | 78 hours | 56 hours |
| July daily high | 27.4°C | 22.4°C |
Precipitation and temperature are 1991 to 2020 normals. Sunshine and sunless days are 1981 to 2010 normals, the most recent sunshine set available. Toronto gets about 220 more hours of sun a year. Vancouver gets about 78 cm less snow and has about 22 more wet days.
Edge: depends on you. If you hate shovelling and icy sidewalks, Vancouver. If grey, wet winters get you down, Toronto.
Round 9: Nature and green space
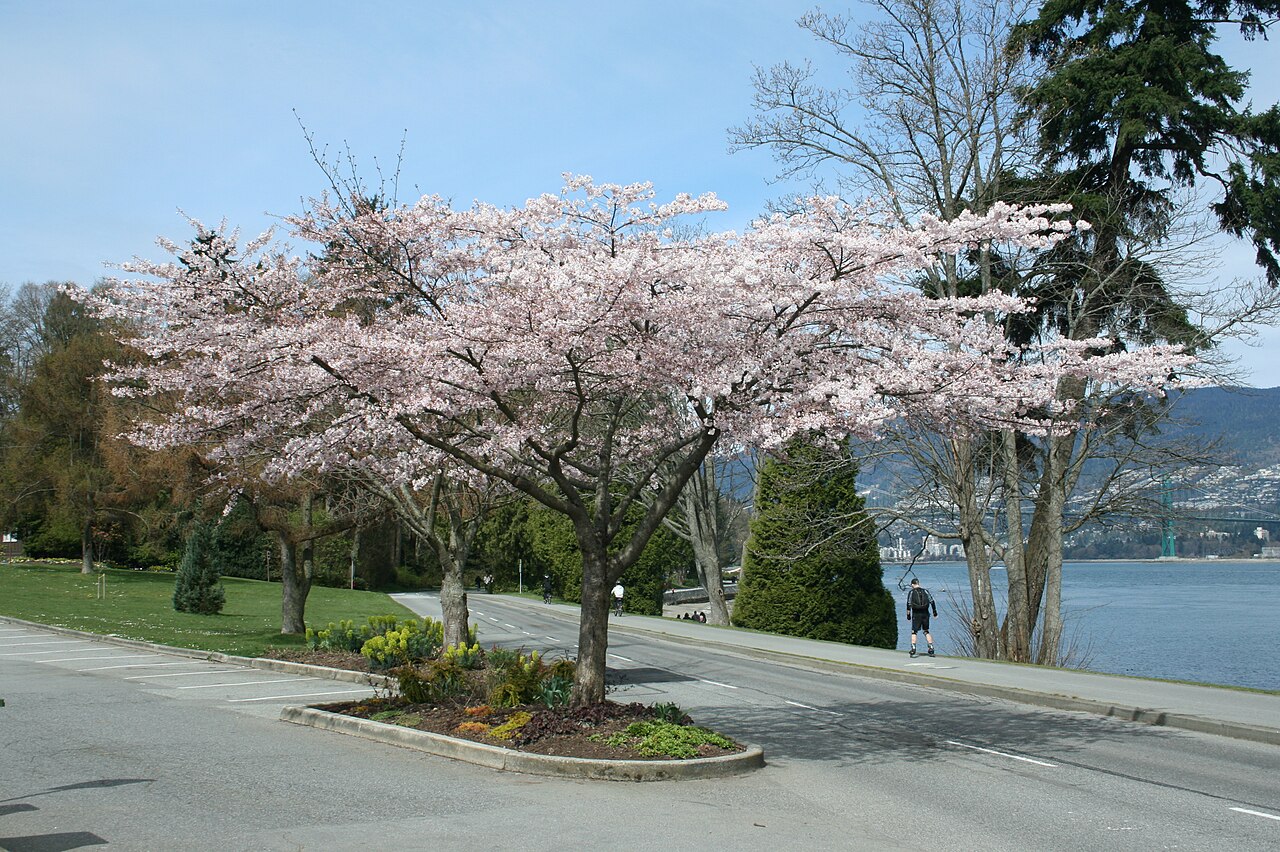
Vancouver’s selling point is the setting. Stanley Park alone covers about 400 hectares, nearly three-quarters of it forest, with well over half a million trees and a seawall walk of about 9 km around it, according to the City of Vancouver. The North Shore mountains are a short drive from downtown.
Toronto’s answer is less famous but bigger than most people expect. The city’s ravine system covers about 11,000 hectares, around 17% of the city’s land, according to the City of Toronto’s Ravine Strategy. That is roughly 27 times the area of Stanley Park. Add the Toronto Islands and the Lake Ontario waterfront and Toronto has more green space than its reputation suggests.
Edge: Vancouver, for the ocean and mountains. Toronto keeps it closer than you would think.
Round 10: Global liveability rankings
In the Economist Intelligence Unit’s Global Liveability Index, Vancouver moved up to 9th place in 2026 (score 96.0, up from 95.8), according to CIC News. Toronto was 16th in 2025, down from 12th the year before. We could not verify Toronto’s 2026 position, so we show the 2025 rank. The index scores stability, healthcare, culture and environment, education and infrastructure. It does not measure housing costs, which is the biggest weakness of both cities.
Edge: Vancouver.
Round 11: What residents say
People in both cities are unhappy about affordability. Toronto residents are a little more ready to leave.
- Who would move for a cheaper city? In a Royal LePage survey (Burson, June 2026), 55% of GTA residents and 46% of Greater Vancouver residents said they would consider buying a home in one of Canada’s 15 most affordable cities if they could work there or remotely. Lower cost of living was the top reason (55%).
- Toronto’s mood. An Ipsos poll for the Toronto Region Board of Trade (801 adults, July 20 to August 4, 2026) found 37% of residents likely to leave Toronto within five years because of affordability. That rose to 52% for Gen Z and 46% for Millennials. 55% said the city’s prosperity is on the wrong track.
- Ownership feels out of reach. In an Ipsos poll for the Toronto Star (September 2026), 69% of Torontonians said owning a home in the city is only for the rich. That is still a large majority, but six points lower than a year earlier.
- Where people are actually moving. Ontario lost a net 18,015 people to other provinces in the 12 months to July 1, 2026 (Ontario Ministry of Finance). BC gained a net 5,990 in the 12 months to April 1, 2026 (BC Stats). The Vancouver region itself, though, lost people to other provinces for a second straight year in 2024 to 2025, according to Statistics Canada.
Edge: Vancouver, narrowly. Both are high numbers.
Facts most people get wrong
- Toronto’s growth stopped. The Toronto CMA’s population was essentially unchanged from July 2024 to July 2025 (-992 people), a year after record growth of +269,143. Statistics Canada says the main reason was a net loss of non-permanent residents.
- Toronto gets more winter sun than Vancouver. Toronto averages 78 hours of sun in December. Vancouver averages 56.
- Vancouver goes years with almost no snow. 2015 had no measurable snow at the airport, only a trace on December 17. July 2013 had no rain at all, a first in its records.
- Toronto has the longer commute but not the more car-dependent one. Its car share (69.4%) is slightly lower than Vancouver’s (70.1%).
- Vancouver incomes are catching up. Its median after-tax household income grew 16.1% from 2015 to 2020, the largest gain among the metros in Statistics Canada’s census release.
Weigh it yourself: which city fits you?
Move the sliders to show how much each factor matters to you. The tool uses only the round results above and doesn’t store anything.
The tool needs JavaScript. The scorecard above has the same information.
The verdict: Toronto or Vancouver?
Neither city is better for everyone. These are the cases where the numbers lean clearly one way:
- First-time buyers: Toronto. A benchmark home is $158,300 cheaper. BC’s first-time buyer exemption saves more tax below $860,000 (about $10,475 more at $800,000), but that is small next to the price gap.
- Renters on a tight budget: Toronto, by about $2,300 to $2,400 a year in asking rent.
- High earners who already own: Vancouver. Provincial income tax is about $3,200 a year lower at $150,000, and a move-up purchase costs less in transfer tax.
- People who hate winter or long commutes: Vancouver. About 37 fewer snowy days a year and around 30 fewer commuting hours.
- People who need sunshine: Toronto, with about 220 more hours of sun a year and 19 fewer days with none.
- Career builders: it depends on your field. Vancouver’s unemployment rate is lower right now, and Toronto households earn more. Check job postings in your field in both cities before deciding.
If you are leaning toward staying in the GTA, our first-time buyer guide for Ontario covers rebates, costs and steps. If you already own and want to know what your home would fetch, request a free home evaluation, or browse homes on our buy a home page.
This article is general information, not financial, tax, legal or mortgage advice. Prices, rents and tax rules change. Check current figures and get professional advice before you move or buy.
Toronto vs Vancouver: questions and answers
Is Toronto or Vancouver more expensive to live in?
Vancouver is more expensive for housing. In September 2026 its composite benchmark home price was $1,075,900, compared with $917,600 in the GTA, and its average asking rent was about $200 a month higher. Vancouver has lower provincial income tax and lower land transfer tax, which close part of the gap.
Which city has better weather, Toronto or Vancouver?
Vancouver has milder winters, with 36.6 cm of snow a year compared with 114.5 cm at Toronto Pearson, and about 7 snowy days compared with about 45. Toronto is sunnier, with about 2,161 hours of bright sunshine a year compared with 1,938, and has hotter summers. Vancouver has more wet days, 169.5 compared with 147.3.
Do people earn more in Toronto or Vancouver?
Toronto households earn more. The latest census figures put median after-tax household income at $85,000 in the Toronto CMA and $79,500 in the Vancouver CMA (2020 incomes). Vancouver’s unemployment rate was lower in September 2026, at 6.5% compared with 6.9%.
Is it cheaper to buy a first home in Toronto or Vancouver?
On price, Toronto. On tax, it depends on the price. Under $500,000 a BC first-time buyer pays no property transfer tax. At $800,000 they pay about $6,000, compared with $16,475 for a Toronto first-time buyer. At $1 million, BC’s exemption no longer applies: it’s $18,000 in Vancouver compared with $24,475 in Toronto. The lower Toronto purchase price usually matters more than the tax.
Which city ranks higher for liveability?
Vancouver. It placed 9th in the EIU’s 2026 Global Liveability Index. Toronto placed 16th in the 2025 index. The index does not measure housing costs.
Are people leaving Toronto and Vancouver?
Many are thinking about it. A June 2026 Royal LePage survey found 55% of GTA residents and 46% of Greater Vancouver residents would consider moving to a more affordable city if they could work there. Ontario lost a net 18,015 people to other provinces in the year to July 1, 2026.
Sources
- TRREB Market Watch, September 2026: GTA benchmark, average price, sales, condo prices.
- The Canadian Press via BNN Bloomberg, October 2, 2026: Greater Vancouver Realtors September 2026 benchmark and sales.
- Daily Hive, October 7, 2026 and Daily Hive Vancouver, October 7, 2026: Rentals.ca and Urbanation September 2026 asking rents.
- CP24, October 7, 2026: national asking rent and Urbanation comments.
- Statistics Canada, 2021 Census: median after-tax household income by CMA.
- The Canadian Press, October 9, 2026: September 2026 Labour Force Survey unemployment by city.
- Government of BC, 2026 tax rates, BC basic personal amount, Raymond Chabot Grant Thornton, Ontario 2026 tax tables and TaxTips.ca, Ontario Health Premium.
- City of Toronto, MLTT rates, BC property transfer tax and BC first time home buyers’ exemption.
- Statistics Canada, commuting, May 2025.
- Climate of Vancouver and the Toronto Pearson climate table on Wikipedia, both compiled from Environment and Climate Change Canada climate normals; Current Results, sunless days and December sunshine (ECCC 1981 to 2010 normals).
- City of Vancouver, Stanley Park map and guide; Toronto ravine system (citing the City of Toronto Ravine Strategy, 2017).
- CIC News, EIU 2026 index; Immigration.ca, EIU 2025 index.
- Royal LePage survey via MPA, June 2026; Toronto Region Board of Trade and Ipsos, 2026; Ipsos for the Toronto Star, September 2026.
- Ontario Demographic Quarterly, Q2 2026; BC Stats quarterly population highlights, Q1 2026; Statistics Canada, population estimates by CMA, 2025.
Ratios, gaps, tax estimates and commute hours are Local Toronto calculations from the sources above. Images: Stanley Park by Alexey Golubev, CC BY-SA 4.0; CityPlace by Canmenwalker, CC BY 4.0; both via Wikimedia Commons.

Local Toronto, HomeLife Landmark Realty Inc., Brokerage.